Mobile Data Usage
Analysis using FlowMachine directly
In this worked example we assume the role of an analyst within the MNO who has been granted access to use FlowMachine directly without going through FlowAPI. Our aim is to investigate how the number of mobile data session (MDS) events varies with the time of day.
The Jupyter notebook for this worked example can be downloaded here, or can be run using the quick start setup.
Load FlowMachine and connect to FlowDB
We start by importing the FlowMachine library. We also import geopandas and mapboxgl, which we will use later to to visualise the data.
import flowmachine
from flowmachine.core import make_spatial_unit
import os
import numpy as np
import geopandas as gpd
import mapboxgl
from mapboxgl.utils import (
    create_color_stops,
    create_weight_stops,
    df_to_geojson,
)
Next, we connect FlowMachine to FlowDB. The following configuration options should either be set as environment variables or passed as arguments to flowmachine.connect():
| Variable name | Argument name | Purpose |
|---|---|---|
| FLOWMACHINE_FLOWDB_USER | flowdb_user | Your username for connectiong to FlowDB |
| FLOWMACHINE_FLOWDB_PASSWORD | flowdb_password | Your password for connectiong to FlowDB |
| REDIS_PASSWORD | redis_password | The password for the Redis instance |
| FLOWDB_PORT | flowdb_port | Port on which FlowDB is accessible |
| REDIS_PORT | redis_port | Port on which Redis is accessible |
Other configuration options can also be set; see the FlowMachine documentation for more details.
flowmachine.connect()
Get MDS event counts
We create a TotalLocationEvents query to calculate the number of MDS events per cell tower, at hourly intervals over the first 7 days of 2016.
data_events_query = flowmachine.features.TotalLocationEvents(
    start="2016-01-01",
    stop="2016-01-08",
    table="events.mds",
    spatial_unit=make_spatial_unit("versioned-cell"),
    interval="hour",
)
Then we call the get_dataframe method to run this query and get the result as a pandas DataFrame.
data_events = data_events_query.get_dataframe()
Next, we sum over the seven days to get total hourly counts per cell tower location.
events_per_hour = data_events.groupby(["lon", "lat", "hour"]).sum().reset_index()
Visualise data events on a heatmap
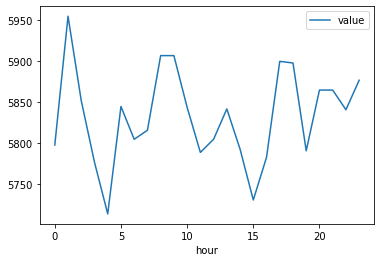
We can easily view the total MDS event count per hour using the plot method of events_per_hour.
%matplotlib inline

events_per_hour.groupby("hour").sum().plot(y="value")
We can use the Mapbox GL library to display a heatmap of our MDS event counts for a particular hour.
Note: Mapbox requires an access token, which should be set as the environment variable MAPBOX_ACCESS_TOKEN. Note that this is only required for producing the Mapbox visualisations, which is completely separate from FlowKit.
hour_to_show = 0

mapbox_token = os.environ["MAPBOX_ACCESS_TOKEN"]

events_per_hour_geodataframe = gpd.GeoDataFrame(
    events_per_hour,
    geometry=gpd.points_from_xy(events_per_hour.lon, events_per_hour.lat),
)

heatmap_viz = mapboxgl.HeatmapViz(
    events_per_hour_geodataframe[
        events_per_hour_geodataframe.hour == hour_to_show
    ].__geo_interface__,
    access_token=mapbox_token,
    weight_property="value",
    weight_stops=create_weight_stops(np.geomspace(0.01, 1000, 9)),
    color_stops=create_color_stops(np.linspace(0.01, 1, 9), colors="RdPu"),
    radius_stops=[[0, 0], [5.5, 25], [15, 300]],  # increase radius with zoom
    opacity=0.8,
    below_layer="waterway-label",
    center=(84.1, 28.4),
    zoom=5.5,
)

heatmap_viz.show()